This article is part of our MLB Observations series.
I explained the methodology in Part 1. Now let's dive into the specifics.
The first thing I do is download Steamer and The Bat projections for hitters and pitchers and sort them separately by a simple fantasy-centric formula to get them in a rough draft order. Then, I calculate the replacement value and standard deviation in each category for the relevant pool of each -- for hitters the top 168 players and for pitchers, it's the top 108, i.e., the 14-hitter/nine-pitcher starting rosters for each team times 12.
Replacement value for the entire pool isn't especially important, but it helps me put them in order, and once they're in order, the standard deviation for each category among the entire pool is important. It's the basis for determining how much each player contributes (or detracts) in each category.
Next, I separate the catchers from the hitters to account for positional scarcity, and the relief pitchers from the starters to account for the scarcity of saves and how the NFBC game is actually played. Because nearly half of the entry fee goes toward the overall contest, and there is no trading (for obvious reasons), one must draft to compete in every category, making the rare players who contribute in saves and steals much more costly than they would be without the overall component. (You could be in the 30th percentile in saves and win a 12-team league, but it is virtually impossible to be below 50 percent in any category and beat out more than 2100 other teams.)
That leaves 144 non-catcher active hitters and 24 active catchers, 30 active relief pitchers and 78 active starters. The 78 and 30 presume 6.5 starting pitchers (times 12 teams) and 2.5 relievers per team, respectively. (Again, you can technically go with nine pitchers of any kind, but due to the focus on the overall contest teams typically go six starters/three relievers or seven and two, respectively.)
Calculating replacement value, i.e., the baseline stats in each category above which a player's contributions add value, for each group is more art than science. You could go with starting pitcher number 79 because he's the next most valuable player, presumably available on someone's bench, but he might be a ground-baller with good ERA, bad WHIP and below-average Ks, i.e., an odd case, and not one you want to use as the typical replacement to which the rest of the pool is compared. It's better to use an average of 20-40 pitchers to smooth out the quirks of any one player.
But even then, it's not obvious what range to use for replacement. If you go 79-108, for example, you're getting everyone's bench and some of the waiver wire, but most of the starters in that range aren't projected for full seasons, i.e., comparing full season starters to part-time starters will make too many players have value simply for showing up and pitching 180 or more innings. Put differently, your pitching slots will be filled by stars at the top and a mix-and-match of available and healthy two-start starters, two-month wonders and average pitchers with good match-ups.
Accordingly, replacement value has to be slightly higher, but we don't want it too high, e.g, starting pitchers 40-60, because then even pitchers 31-39 would have barely any value, and an even more lopsided portion of the $893.63 starting pitching budget would be diverted to the top five or 10 pitchers. So there's no perfect formula for replacement value, but for starting pitchers I settled on the average of 60-90 for a baseline of nine wins, 4.30 ERA, 1.30 WHIP and 143 strikeouts in 155 IP or 26 starts. That pitcher, prorated on a per-start basis, is what my projections consider freely available, before taking into account two-start weeks, opponent, etc.
For catchers, I used the average of catchers 20-30, for relief pitchers, the average of RPs 25-35. Once I establish a baseline of stats, I subtract those from each player's actual stats to get their value in each category above or, as the case may be, below replacement. Then I take the replacement stats and divide them by the standard deviation in each category for the overall pool. It's important to take the standard deviation for hitters generally in stolen bases, for example, and not just in the catcher pool when deciding how much J.T. Realmuto is worth. Yes, his six steals would be monstrous in a catcher-only league, but it doesn't move the needle much for your team in that category.
So I account for catcher and closer scarcity by adjusting replacement value, but once those baselines are subtracted out, the players' relative contributions are measured on the same scale as everyone else's. The question for each player is what are his contributions in each category, relative to the appropriate baseline. The replacement value sets that baseline according to his position, and the standard deviations allow us to compare the impact across categories.
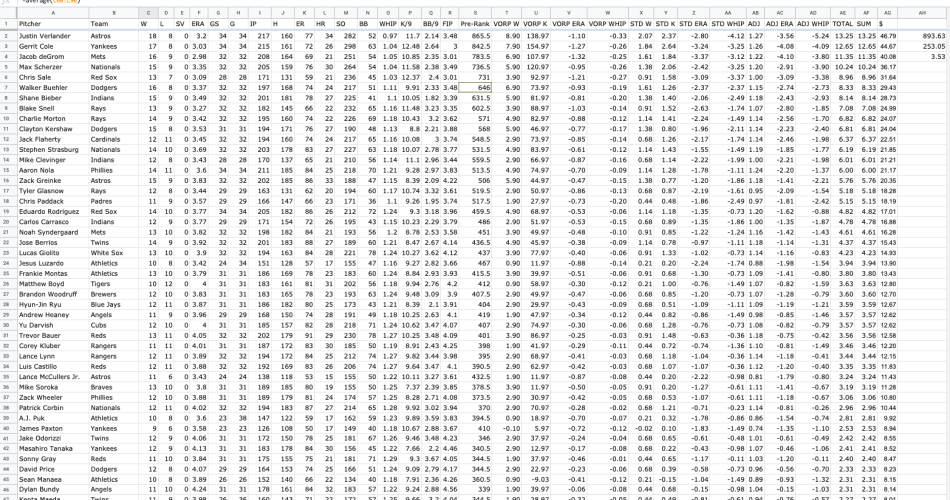
Okay, that's all well and good, but to create an overall ranking, we still have to convert the category contributions into a total. I do this by adding up (or subtracting as the case may be) the number of standard deviations above replacement each player is in each category. See column AE here for an example. Justin Verlander's 13.75 is the biggest number for the starting pitchers. But to get a dollar value, I need to add up the total for all the starting pitchers -- remember there are 78 active ones at any given time -- and then apportion the NFBC starting pitching budget we calculated in Part 1 among them.
It turns out the top 78 pitchers equal 253.05 in total standard deviation category points. And we know the total dollars (based on the standard $260 per team * 12 teams) spent on starting pitching is $893.63. So we simply divide $893.63 by 253.05 = 3.53, and in doing so get our multiplier to convert the standard deviation totals into dollar values -- see column AG.
I do this four times for each of the two projection sets, i.e., Steamer Hitters Without Catchers, Steamer Catchers, Steamer Starting Pitchers, Steamer Relief Pitchers, The Bat Hitters Without Catchers, The Bat Catchers, The Bat Starting Pitchers and the Bat Relief Pitchers.
Now that I have dollar values for everyone, I convert them into overall rankings for Steamer and The Bat. Afterwards I aggregate them giving one sixth weight to Steamer, one sixth to The Bat and two thirds to the recent NFBC ADP.
Then I sort them by overall ranking, and I have The Ultimate Draft List.
A few caveats are in order, though.
First, when I'm doing an NFBC draft, I have to adjust for the market of my specific draft and make sure I'm balanced in the categories and reasonably flexible positionally, i.e., I don't want to take three slow corner infielders and a utility with my first four picks, locking me out of corners the rest of the draft and putting me in deep trouble in speed and pitching, even if the sheet says those are the best values.
Second, I have to update the projections and NFBC ADP before each draft, and I don't (yet) have the tech skills to automate the entire process. I'll do the basics like delete Luis Severino and downgrade Aaron Judge and Giancarlo Stanton's projections, but I haven't re-done every single one. (I might wind up re-downloading the Steamer and Bat projections again in March, but getting them separated and sorted is a fair amount of work.)
Third, as Jeff Zimmerman pointed out, NFBC drafters are aware of these projections systems, so there's some overlap between Steamer, The Bat and NFBC ADP. I don't have a big problem with that so long as each source is contributing unique information that the other is missing. But it's worth noting that aspects of Steamer's projections, which have been out since November or so, could be double-counted if NFBC drafters are relying on it as they collectively establish ADP.
Fourth, while I find this process incredibly helpful for the first 10-15 rounds, it's less so as you get deeper into drafts, and upside is most of what matters. The algorithmic projections for players who don't have guaranteed roles aren't especially relevant, so you're better off simply identifying high-upside lottery tickets and adding them to your draft queues.