


This article is part of our Collette Calls series.
We have made it to August putting us two-thirds of the way through the regular season. The injury rate of late makes it feel like a process of attrition these days, but we are just a few weeks away from rosters expanding back to 28 and giving teams some much-needed relief. It feels like July was a hot month of offense, and the numbers somewhat play that out as July provided the highest numbers of each part of the triple-slash of the 2021 season:
MONTH | BA | OBP | SLG | BB% | K% |
|---|---|---|---|---|---|
Mar/April | .232 | .309 | .389 | 8.9% | 24.4% |
May | .239 | .315 | .397 | 9.0% | 24.0% |
June | .246 | .320 | .417 | 8.8% | 23.2% |
July | .248 | .321 | .421 | 8.7% | 22.7% |
It is tough to get excited about those numbers given the bump is a duck snort or a dying quail in every park each week to bump up the average or a flyball going two feet further to get over the fence. The numbers are up from the extremely slow start to the season, but June and July essentially saw the same levels of performance in terms of production. The league-wide walk rate declined for a third consecutive month while the strikeout rate has declined each month of the season as it has declined seven percent since the start of the season.
If we look at things by a weekly split, we see a slight decline in both rates lately, but nothing as drastic as was hypothesized when the sticky stuff ban came down from upon
We have made it to August putting us two-thirds of the way through the regular season. The injury rate of late makes it feel like a process of attrition these days, but we are just a few weeks away from rosters expanding back to 28 and giving teams some much-needed relief. It feels like July was a hot month of offense, and the numbers somewhat play that out as July provided the highest numbers of each part of the triple-slash of the 2021 season:
MONTH | BA | OBP | SLG | BB% | K% |
|---|---|---|---|---|---|
Mar/April | .232 | .309 | .389 | 8.9% | 24.4% |
May | .239 | .315 | .397 | 9.0% | 24.0% |
June | .246 | .320 | .417 | 8.8% | 23.2% |
July | .248 | .321 | .421 | 8.7% | 22.7% |
It is tough to get excited about those numbers given the bump is a duck snort or a dying quail in every park each week to bump up the average or a flyball going two feet further to get over the fence. The numbers are up from the extremely slow start to the season, but June and July essentially saw the same levels of performance in terms of production. The league-wide walk rate declined for a third consecutive month while the strikeout rate has declined each month of the season as it has declined seven percent since the start of the season.
If we look at things by a weekly split, we see a slight decline in both rates lately, but nothing as drastic as was hypothesized when the sticky stuff ban came down from upon high:
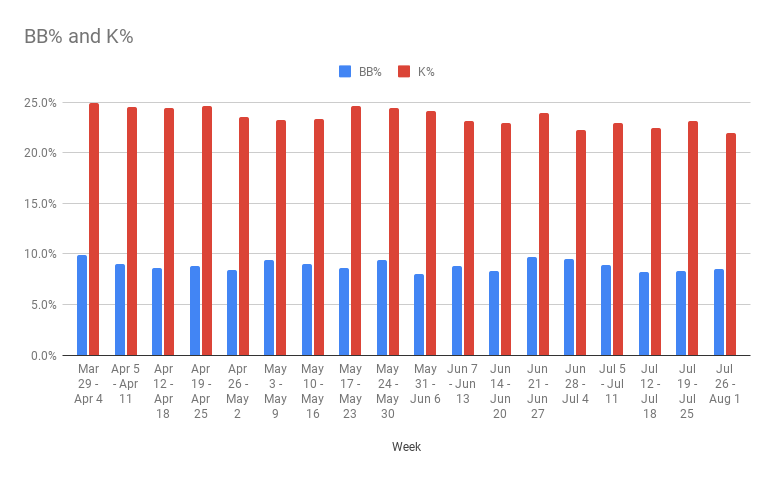
So we have seen fewer strikeouts, but also fewer walks as pitchers have adjusted to the learning curve thrown on them by the league on June 21. That, or hitters are taking advantage of poorly located pitches earlier in the count given strikeouts have also dipped. Meanwhile, each component of the triple-slash line has improved ever so slightly as the season has worn on, but slugging percentage, in particular, has flatlined in recent weeks which feels antithetical to some of the box scores we saw in July:
Maybe it just felt like July was a big month for offense because numbers got off to such a poor start. There was a slight bump after the dip following the all-star break, but things have mostly been the same for quite some time now. The numbers look even worse when you compare July 2021 to more recent full months of July during the evolving ball era (2015-2021):
| Season | AVG | OBP | SLG | BB% | K% |
|---|---|---|---|---|---|
| 2015 | 0.255 | 0.316 | 0.403 | 7.3% | 20.1% |
| 2016 | 0.252 | 0.318 | 0.413 | 8.0% | 21.1% |
| 2017 | 0.257 | 0.326 | 0.430 | 8.5% | 21.8% |
| 2018 | 0.255 | 0.325 | 0.418 | 8.5% | 21.6% |
| 2019 | 0.257 | 0.323 | 0.445 | 8.1% | 23.2% |
| 2021 | 0.248 | 0.321 | 0.421 | 8.7% | 22.7% |
This past month was the worst July in recent history by batting average, and quite the step back from the bouncy ball of July 2019. It did see the highest walk rate of any recent July, but also saw the second-highest strikeout rate. If we look into the type of contact being made, we are reminded the ball does not go as far these day and the amount of hard contact has noticeably declined from the two most recent full months of July:
Season | HR/FB | Soft% | Med% | Hard% |
|---|---|---|---|---|
2015 | 11% | 19% | 53% | 29% |
2016 | 12% | 19% | 50% | 31% |
2017 | 14% | 19% | 50% | 32% |
2018 | 13% | 18% | 47% | 35% |
2019 | 16% | 16% | 45% | 39% |
2021 | 14% | 16% | 51% | 33% |
The quality of the contact may be suffering a bit, but there is some good news that has trended throughout this 2021 season, starting with the increase in contact. The only other potential area of concern for offense is pitchers appear to be doing a better job at suppressing hard contact of late based on average exit velocity and the percentage of balls hit 95-plus:
Month | Avg Exit Velo | Hit 95+% |
|---|---|---|
Mar/Apr | 88.3 | 40% |
May | 88.1 | 39% |
June | 88.3 | 39% |
July | 87.8 | 38% |
Aug | 87.5 | 37% |
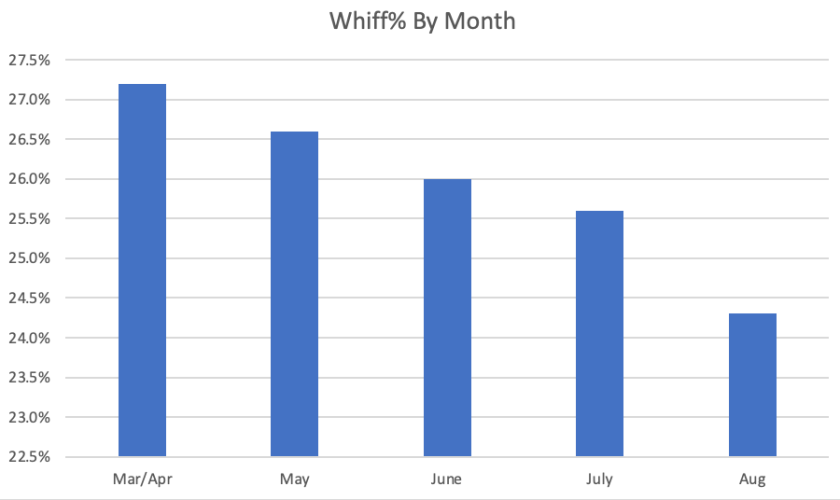
While the overall strikeout rate has risen, the swing and miss within the game has been on the decline every month this season. We cannot really give all the credit to the sticky stuff ban if the trend has been occurring right under our noses all season:
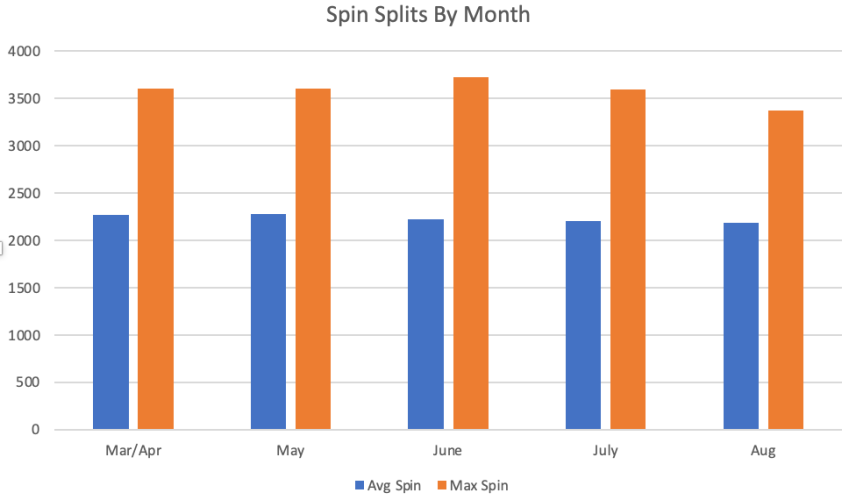
I thought I might find some kind of average velocity decline in looking at monthly splits, yet the league-wide average velocity has held between 88.7 and 88.9 all season. Even the average spin rate across the league have mostly held up, although the max spin rates have not:
All in all, I came into this numbers dive looking for something that could give some guidance for the final third of the season. I leave it as perplexed as I was when I sat down to look into the numbers. Offense does continue to lag and pitchers seemingly are getting the upper hand even though they continue to drop like flies around the league. I wonder how much of this holds up as August continues to bring the heat and players extend into workloads they have not seen in nearly two years, because something has to give in the coming weeks. Offense should be better, but the numbers have not recovered as we normally expect this time of year.