


This article is part of our The Z Files series.
With four months in the book, let's look at where MLB stands offensively. We'll review a bunch of stats by month, then compare the trends to previous seasons.
| Month | G | PA | R/G | HR% | BA | BABIP | HardHit% | SB/G | SB% | BB% | K% |
|---|---|---|---|---|---|---|---|---|---|---|---|
| July | 734 | 27798 | 4.64 | 3.30% | 0.249 | 0.297 | 39.40% | 0.69 | 80.51% | 8.44% | 22.75% |
| June | 780 | 29508 | 4.53 | 3.09% | 0.248 | 0.297 | 39.70% | 0.74 | 78.72% | 8.38% | 22.77% |
| May | 830 | 31410 | 4.55 | 3.10% | 0.249 | 0.297 | 40.10% | 0.71 | 79.95% | 8.70% | 22.35% |
| March/April | 850 | 32143 | 4.59 | 2.99% | 0.247 | 0.298 | 39.40% | 0.71 | 79.31% | 8.81% | 23.03% |
Runs Per Game
Here is a graphical view of runs per game since 2021.
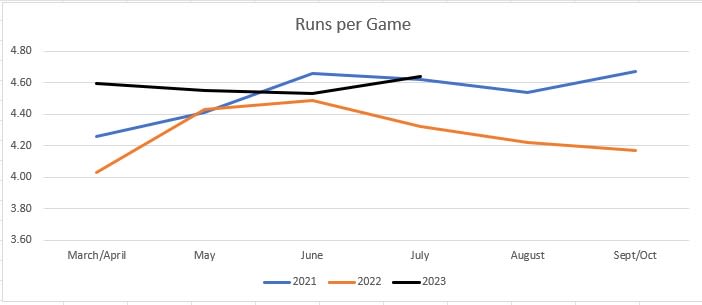
Wait, I though run scoring was up. That guy from Breaking Bad seems to think so. Clearly, scoring was up early, but in June, it fell below 2021's level and was just a tick above last season's mark. Of course, scoring plummeted the second half of last season while it looks to be pacing similarly to 2019. If my math is correct, that's just two years ago. MLB instituted a slew of changes just so the game would revert to... 2021. Huh.
HR%
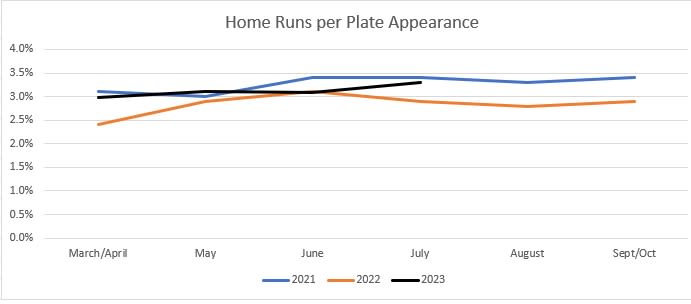
Unsurprisingly, overall homers track well with runs. However, this season, the relationship isn't as strong.
| Season | R-squared |
|---|---|
| 2023 | 0.59 |
| 2022 | 0.86 |
| 2021 | 0.88 |
The most obvious reason is... I'm not sure if you've heard, but stolen bases are way up this season.
Stolen Bases
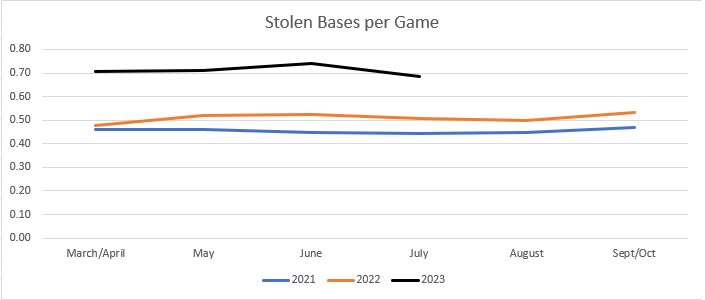
I'll save it for a follow-up Z Files, or an intro to Todd's Takes, but we're at the point of the
With four months in the book, let's look at where MLB stands offensively. We'll review a bunch of stats by month, then compare the trends to previous seasons.
| Month | G | PA | R/G | HR% | BA | BABIP | HardHit% | SB/G | SB% | BB% | K% |
|---|---|---|---|---|---|---|---|---|---|---|---|
| July | 734 | 27798 | 4.64 | 3.30% | 0.249 | 0.297 | 39.40% | 0.69 | 80.51% | 8.44% | 22.75% |
| June | 780 | 29508 | 4.53 | 3.09% | 0.248 | 0.297 | 39.70% | 0.74 | 78.72% | 8.38% | 22.77% |
| May | 830 | 31410 | 4.55 | 3.10% | 0.249 | 0.297 | 40.10% | 0.71 | 79.95% | 8.70% | 22.35% |
| March/April | 850 | 32143 | 4.59 | 2.99% | 0.247 | 0.298 | 39.40% | 0.71 | 79.31% | 8.81% | 23.03% |
Runs Per Game
Here is a graphical view of runs per game since 2021.
Wait, I though run scoring was up. That guy from Breaking Bad seems to think so. Clearly, scoring was up early, but in June, it fell below 2021's level and was just a tick above last season's mark. Of course, scoring plummeted the second half of last season while it looks to be pacing similarly to 2019. If my math is correct, that's just two years ago. MLB instituted a slew of changes just so the game would revert to... 2021. Huh.
HR%
Unsurprisingly, overall homers track well with runs. However, this season, the relationship isn't as strong.
| Season | R-squared |
|---|---|
| 2023 | 0.59 |
| 2022 | 0.86 |
| 2021 | 0.88 |
The most obvious reason is... I'm not sure if you've heard, but stolen bases are way up this season.
Stolen Bases
I'll save it for a follow-up Z Files, or an intro to Todd's Takes, but we're at the point of the season where you can leverage teams running more against batteries that have trouble nabbing would-be base stealers.
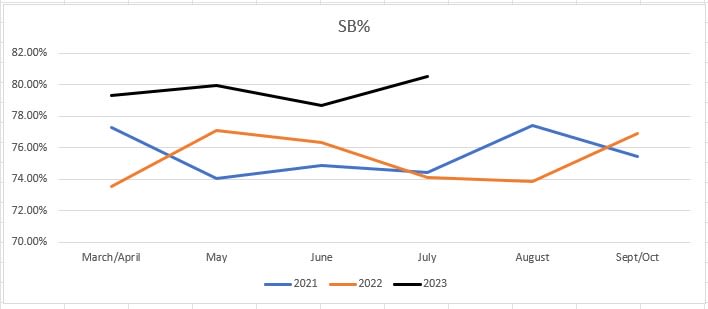
For this discussion, the observation used to be that running was usually more prominent in a low run-scoring environment, but the confluence of all the rules changes have manifested more bags even while power is up. Comparing 2021 and 2022, fewer runs were tallied in 2021, but there were more pilfers. This syncs with multi-year major-league trends.
Of course, steals aren't the only difference from last season. In 2022, the shift was in play 33 percent of the time, though many make it seem like it was higher. Anyway, let's see how shift legislation has influenced batted balls.
Batting Average and BABIP
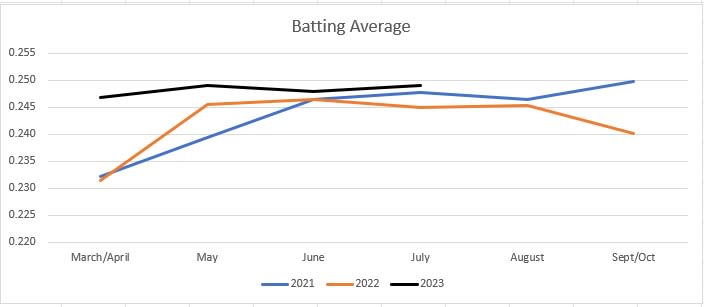
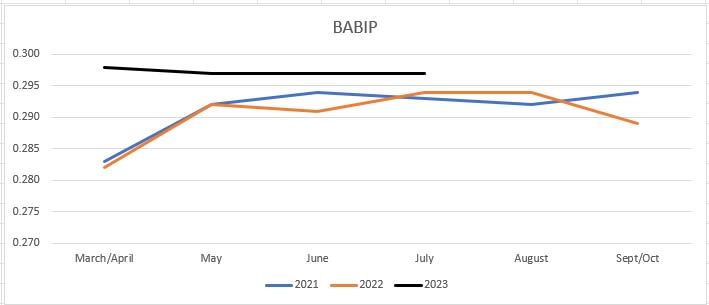
The bottom line is batting average and BABIP are up. However, this season there has been limited monthly variance, as opposed to the past two seasons where it started low, then increased. In July, batting average and BABIP were still higher than the previous two seasons, but not by much. We need the final two months of data to draw conclusions, but for all the talk about how no shift will revolutionize the game, in terms of batting average and BABIP, they've been virtually the same as the prior two campaigns.
HardHit% is defined by Statcast as the percentage of batted balls with an exit velocity of at least 95 mph. The metric correlates quite well with BABIP.
Statcast Hard Hit Rate
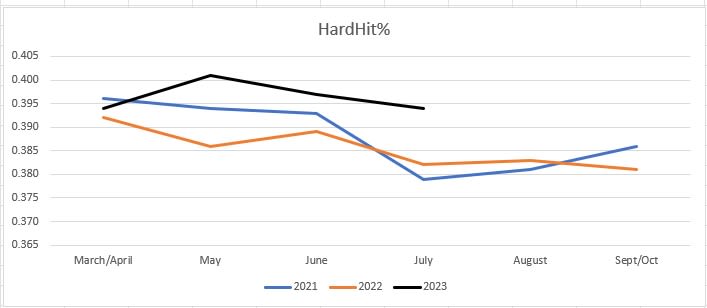
While HardHit% tracks well with BABIP, it isn't perfect since homers are included with HardHit% but they are excluded from BABIP. The main point of the above graph is to show there is a bit more contact of at least 95 mph this season compared to the prior two years. Perhaps this is a result of shift legislation, or just happenstance, but it's another explanation for the increase in BABIP. That is, the BABIP bump is more than player positioning; there is harder contact.
Strikeout and Walk Rates
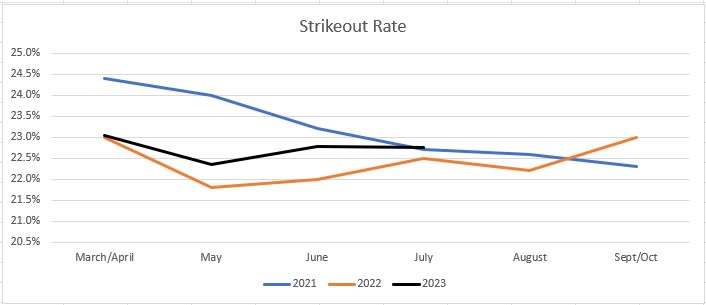
Strikeouts and walks are the final two components of the run environment. In 2021, the mid-season institution of umpires checking for grip enhancement is the logical reason why strikeouts have dipped from that season and mostly stabilized, though punchouts are up a bit this season. The effect has been to somewhat temper the increase in batting average and soften the effect of more steals.
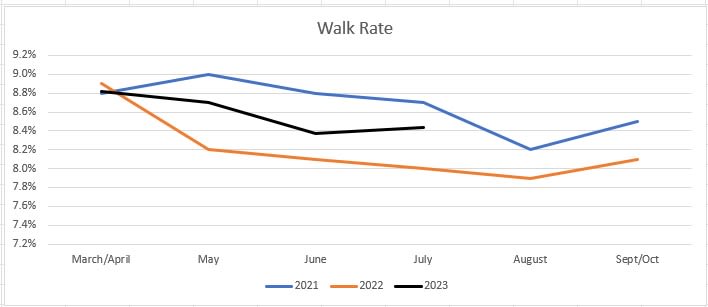
So far, free passes are splitting the difference between the previous two seasons. I'm not sure there is a reason beyond variance. Legislating grip enhancement didn't have an adverse effect in 2021.
On the other hand, walks are one of the factors that may change as the season progresses and the influence of the pitch clock expands. Or maybe it doesn't. Time will tell.
Summary
The intent of this review wasn't to unearth action items to help win your league(s), but there are a few interesting observations. Even with all that is going on in terms of changes, the month-to-month variance is less than normal. This could be one of the changes countering something that usually occurs, or it can be too small a sample to draw conclusions.
The elephant in the room is that we don't know how things will play out with respect to pitching and the timer. Will the rushed nature of pitching during the first four months eventually catch up to players? Have hitters gained enough experience to reset their routines? Have pitchers made the adjustment?
Honestly, my approach with pitching remains the same. Don't force two-start pitchers. Instead, focus on the best matchups, even though there seem to be more unexpected outcomes, both good and bad, than in past seasons.


