


This article is part of our The Z Files series.
Projection systems are like snowflakes in that no two are alike. However, most incorporate some sort of a weighted average from at least the three previous seasons, including mine. I use a weighted average of the past three years, seasoned with age and regression of the appropriate metrics.
One of the inherent assumptions in that approach is that the environment for the involved seasons is the same, but this is never the case. Weather does not repeat. The schedule is different from year to year. This is one of the reasons projections are best considered as a range, since there is some built-in variance.
Back in 2019, the home run environment was clearly different than surrounding seasons as the baseball was proven to travel further, skewing homer totals. As such, the home runs from 2019 needed to be normalized before comprising one of the inputs for 2020-2022 projections.
Currently, the stolen-base environment is the one in the spotlight. With the new rules instituted for the 2023 season, steals significantly increased. A 20 stolen-base season in 2022 is more impressive than 20 bags last year. Some measure of normalization needs to be applied to SB totals before dumping them into the little black box.
There are multiple ways to handle the correction. With respect to the home run dilemma from a few years ago, the assumption there was that 2019 would be the outlier, so if just those numbers were normalized, the three-year spread would have appropriate inputs.
The scenario with
Projection systems are like snowflakes in that no two are alike. However, most incorporate some sort of a weighted average from at least the three previous seasons, including mine. I use a weighted average of the past three years, seasoned with age and regression of the appropriate metrics.
One of the inherent assumptions in that approach is that the environment for the involved seasons is the same, but this is never the case. Weather does not repeat. The schedule is different from year to year. This is one of the reasons projections are best considered as a range, since there is some built-in variance.
Back in 2019, the home run environment was clearly different than surrounding seasons as the baseball was proven to travel further, skewing homer totals. As such, the home runs from 2019 needed to be normalized before comprising one of the inputs for 2020-2022 projections.
Currently, the stolen-base environment is the one in the spotlight. With the new rules instituted for the 2023 season, steals significantly increased. A 20 stolen-base season in 2022 is more impressive than 20 bags last year. Some measure of normalization needs to be applied to SB totals before dumping them into the little black box.
There are multiple ways to handle the correction. With respect to the home run dilemma from a few years ago, the assumption there was that 2019 would be the outlier, so if just those numbers were normalized, the three-year spread would have appropriate inputs.
The scenario with 2023 stolen bases is different, since the expectation is that they continue to be elevated. One means of handling the present landscape is to adjust 2021 and 2022 totals as if they were generated in the 2023 season. The output doesn't need to be adjusted, since the inputs all factor in the new environment. Another pathway is to normalize last season to the conditions of the previous two seasons, then adjust the 2024 projections to jive with the current environment.
Regardless of the process, the way to make an apples-to-apples comparison needs to be determined. That is, from where did the added steals emanate? Was the increase linear? Did different subsets of players increase more or less than others?
Furthermore, there are two aspects of a stolen base: the number of opportunities and the success rate. To get a full grasp on the increase, these need to be investigated separately, since not only did players run more often, their success rate jumped from averaging around 75 percent in recent seasons to a historically high 80.2 percent.
Stolen Base Opportunities
There are more sophisticated means of tracking stolen base opportunities, but the number of times a batter reached first via single, walk or hit batsman is a suitable proxy, even though there are a few other means of getting on base and not every time on base is a chance to steal. Not to mention, stealing third base also increased. Still, singles, walks and HBP are readily attainable, and work for this purpose.
To account for playing time, the metric studied is of the rate variety, with steals plus caught stealing in the numerator and stolen base opportunities in the denominator (SBO%). To be included, a minimum of 200 plate appearances and at least five steals in 2022 is required, along with at least 200 plate appearances last season.
To help account for outliers, overlapping sets of 10 players will be analyzed, ordered by low SBO% to high SBO%. The 2023 data is the results from the 10 players comprising each 2022 group. The X-axis is SBO prorated to 600 PA for each set of 10 samples.
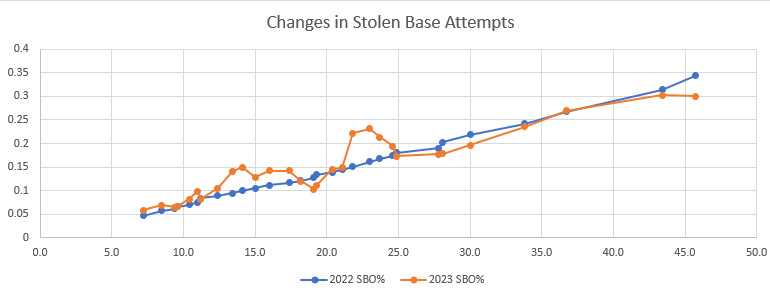
Drawing conclusions from one season of data is precarious, but in this case, that's all we have.
- The data points between 7 SBO and 12 SBO show a small tick up in times attempting a steal.
- There is a larger bump between 12 SBO and 17 SBO
- An odd dip between 17 SBO and 21 SBO puts a dent in the potential observation of SBO% increasing more as SBO increases.
- Huge jump from 22 SBO to 23 SBO, then it declines at 25 SBO.
- After 25 SBO, players ran a bit less, or the same.
Let's take a closer look at the dip between 17 SBO and 21 SBO. If it's real, this is important to the normalization discussed earlier. If it's due to a cluster of outliers not smoothed by the overlapping analysis, there is a very strong case for SBO% increasing as SBO increases.
Here is the data in question, with an explanation to follow.
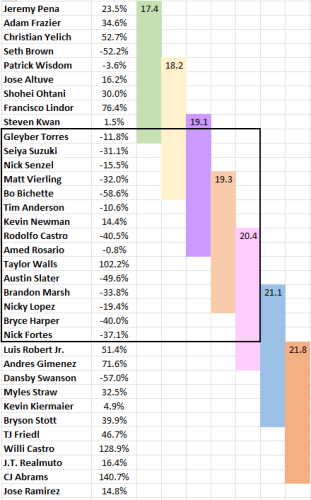
The second column is the percent change of SBO% from 2022 to 2023. The colored bars represent the group of 10 players encompassing a data point, with the prorated number of SBO per 600 plate appearances as the label. These are the points plotted on the above graph.
Look at the players within the box. There is an inordinately high number of players who ran less frequently last season. An astounding 13 of 15 players show a drop in SBO%, accounting for the drop below the 2022 level on the graph. Of the 20 players shown above and below the box, just three attempted to steal at a lower clip last season.
With only one year of data, it's not possible to discern if this is a wild coincidence, or whether there is something about their 2022 level driving the dip. Personally, I have trouble believing the decline is real. Why would players with this range of SBO% run less frequently when the trend immediately before and after shows an increase? That said, 87 percent with a negative result seems too big not to have some credence.
After much contemplation, I opted to essentially ignore the data of the boxed group and make the formulaic adjustment as if the line on the left remained above the 2022 level. However, I followed up by looking at each player on an individual basis, often softening the effect of the normalization.
Bo Bichette is a good example to highlight, since he's an early-round draftee whose steals (or the lack thereof) have a huge influence on his market price. The manner I normalized to the current environment is by adjusting 2021 and 2022 SBO% to reflect the present landscape. With Bichette, I overrode the adjustment, leaving it alone. Here is Bichette's stolen base projection:
| PA | SBO% | SB | CS | |
|---|---|---|---|---|
| Proj | 614 | 6.8% | 8 | 3 |
| 2023 | 571 | 5.3% | 5 | 3 |
| 2022 | 652 | 12.8% | 13 | 8 |
| 2021 | 640 | 14.7% | 25 | 1 |
Had the 2021 and 2022 seasons been adjusted, Bichette would have projected for 16 steals, increasing his projected earnings by $3. I'm essentially saying I think he'll run a little more, but nowhere near the pace he exhibited previously.
Stolen Base Success Rate
The second aspect of stealing bases is the success rate. As mentioned, 2023 marked a new leaguewide success rate, five points higher than the previous few seasons. Intuitively, this makes perfect sense with the larger bases, and limiting disengagements from the rubber.
The question is whether everyone's success rate went up five percent, or did some players increase more dramatically than others? These results will be applied in tandem with SBO% results to shape 2024 stolen base expectations.
The study mimics the earlier one, with SB% (stolen base success rate) under the microscope. The SB% of overlapping groups of 10 players is graphed for 2022 and 2023.
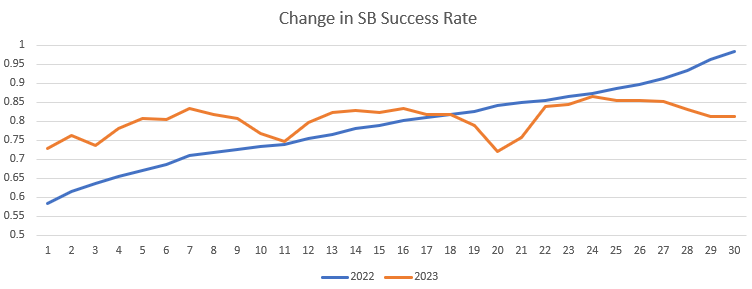
Here, the X-axis is just the number of the group. here is the data in tabular form.
| Group | 2022 | 2023 | % change |
|---|---|---|---|
| 1 | 58.4% | 72.9% | 24.7% |
| 2 | 61.5% | 76.3% | 24.1% |
| 3 | 63.6% | 73.6% | 15.7% |
| 4 | 65.4% | 78.2% | 19.6% |
| 5 | 67.1% | 80.6% | 20.2% |
| 6 | 68.5% | 80.4% | 17.4% |
| 7 | 70.9% | 83.3% | 17.5% |
| 8 | 71.9% | 81.9% | 13.9% |
| 9 | 72.6% | 80.7% | 11.2% |
| 10 | 73.3% | 76.9% | 4.9% |
| 11 | 73.8% | 74.6% | 1.1% |
| 12 | 75.4% | 79.7% | 5.6% |
| 13 | 76.6% | 82.4% | 7.5% |
| 14 | 78.0% | 82.9% | 6.3% |
| 15 | 78.9% | 82.3% | 4.2% |
| 16 | 80.2% | 83.3% | 3.9% |
| 17 | 81.0% | 81.9% | 1.0% |
| 18 | 81.8% | 81.8% | 0.0% |
| 19 | 82.7% | 79.0% | -4.4% |
| 20 | 84.3% | 72.2% | -14.3% |
| 21 | 84.8% | 75.6% | -10.8% |
| 22 | 85.5% | 83.9% | -1.9% |
| 23 | 86.4% | 84.4% | -2.3% |
| 24 | 87.2% | 86.6% | -0.8% |
| 25 | 88.8% | 85.4% | -3.9% |
| 26 | 89.8% | 85.4% | -4.9% |
| 27 | 91.4% | 85.3% | -6.7% |
| 28 | 93.3% | 83.1% | -11.0% |
| 29 | 96.2% | 81.2% | -15.6% |
| 30 | 98.4% | 81.4% | -17.3% |
Clearly, those with poorer 2022 success rate benefited the most, with a small increase for those close to the previous league average of 75 percent. Those with a 2022 success rate over 80% had their rate drop, but it was still a tick over the 2023 league average.
While I'm not surprised the first groups improved the most, the extent is an eye-opener. I did not expect those with a previous success rate around 67 percent to incur such a marked increase. The data from this study will be used to adjust 2021 and 2022 success rates to sync with 2024 expectations.
Applying the Data
In the spirit of getting a glimpse of how the sausage is made, the above data was not applied in full. Instead, previous seasons were regressed towards the 2023 data. This is a means of accounting for the noise encountered in a single season of data. Assuming MLB does not change any more rules, and the repercussions stabilize to close to last season's level, 2021 and 2022 will soon fall out of the foundational three-year average and no adjustments will be necessary.
From a practical perspective, the 2024 stolen base projections will still increase more for specific subsets of players, so in a relative sense, drafters will not be misled. In fact, tempering expectations for those with huge jumps last season could be a good thing.
SUMMARY
- Players prorating to low 20s stolen bases attempts per 600 plate appearances ran more frequently in 2023.
- After that, players ran at close to their recent rate, but their steals may have increased due to a better success rate.
- Those with lower previous success rates increased the most, whole those with the highest recent rates regressed towards the league average.
- Applying the above is a slippery slope, but it's better than doing nothing. Regressing towards, but not incorporating the full extent of, the changes is a solid compromise to soften the variance from such a small sample.
- Even after a comprehensive adjustment, it is obligatory to manually override on a subjective basis.


