


This article is part of our The Z Files series.
The RotoWire Roundtable: Fantasy Baseball Top 300 December Update has been posted. Your loyal knights will keep tweaking our individual rankings all offseason. There were some significant changes on my part, so I have some 'splaining to do.
The dynamic I struggle with the most is meshing a formulaic ranking with how I would draft. I'm not talking about if I already have a speed guy, so all the other speed guys get lowered. That's a straightforward draft strategy.
So is, "Draft the pitcher, not the round." In other words, if I want to start my staff with pitchers in a specific tier, I can't pass on them if they are going too early; I need to adjust on the fly and dive in when that tier is flying off the board.
My original rankings downgraded pitching too much. Even accounting for the willingness to jump pitchers up my rankings, they were ranked unrealistically low.
Without getting too much into the weeds, when assigning projected earnings, budget share allocated to the hitting pool and pitching pool must be decided. Empirically, the usual split is 69 percent hitting, 31 percent pitching. However, the National Fantasy Baseball Championship has trended to 62 percent hitting, 38 percent pitching. Granted, these are not designed to be NFBC rankings. However, drafts in general are beginning to select hurlers earlier, and my rankings needed to better reflect that.
I didn't adjust my split to NFBC level, but I split the difference, and starting pitchers at the top
The RotoWire Roundtable: Fantasy Baseball Top 300 December Update has been posted. Your loyal knights will keep tweaking our individual rankings all offseason. There were some significant changes on my part, so I have some 'splaining to do.
The dynamic I struggle with the most is meshing a formulaic ranking with how I would draft. I'm not talking about if I already have a speed guy, so all the other speed guys get lowered. That's a straightforward draft strategy.
So is, "Draft the pitcher, not the round." In other words, if I want to start my staff with pitchers in a specific tier, I can't pass on them if they are going too early; I need to adjust on the fly and dive in when that tier is flying off the board.
My original rankings downgraded pitching too much. Even accounting for the willingness to jump pitchers up my rankings, they were ranked unrealistically low.
Without getting too much into the weeds, when assigning projected earnings, budget share allocated to the hitting pool and pitching pool must be decided. Empirically, the usual split is 69 percent hitting, 31 percent pitching. However, the National Fantasy Baseball Championship has trended to 62 percent hitting, 38 percent pitching. Granted, these are not designed to be NFBC rankings. However, drafts in general are beginning to select hurlers earlier, and my rankings needed to better reflect that.
I didn't adjust my split to NFBC level, but I split the difference, and starting pitchers at the top are now ranked higher. I may still be the low man on some, but I'm within shouting distance. Next time, I'll discuss some of the pitchers for which I am more aggressive, then I'll talk about those for which I lag.
Changing the split wasn't the only pitching alteration. Closers were previously way too low. I may not draft closers where I have them ranked, but that's a strategic decision. I'm fading them because of preferred team build, not a distrust in the ranking. That said, more budget was allocated to saves, pushing closers up the rankings.
Which brings me to my next point. You've heard Jeff, Erik, Clay and I talk about battle testing our rankings. This may be hard to believe, but at the time of the initial posting, I had not yet done a draft. Right before the update, I participated in the Lindy's Magazine mock. I take mocks seriously, as does the rest of this room, so it was a solid examination of my rankings. Players who settled at the top of my cheat sheet for several picks/rounds, for which I had no interest, needed to be reviewed. Similarly, players I was afraid would be taken before they were "worth it" needed another look.
The last thing I want to do is artificially change a projection to make it more palatable to users. I have no issue being on an island. That's what the previous two columns discussed, and that will be the focus of the next two. It's the outliers for which I have no explanation that needed addressing in this update.
The first player encountered was Shohei Ohtani. My initial rank was No. 6 overall. The others ranged from 11th to 25th. My colleagues made slight adjustments, but I dropped him to 18th.
There are a few ways to frame a projection. I like to consider it a weighted average of all plausible outcomes. If each season were simulated a gazillion times, the projection would be the average of each season. Some would have the player getting hurt in the first week of the season, some would have him playing almost every game, others in between, with the majority being more practical.
As an aside, this is why playing time projections should be conservative. Marcus Semien hasn't missed a game since grade school. Well, not quite, but excluding the pandemic season, Semien has missed just one game since 2019, with an average of 737 plate appearances per year. Yet, his 2024 projection should be lower than 737 PA. If the season were played a gazillion time, in some, Semien would be hit by a pitch, breaking his hand. It's not going to be simulated a lot, but it is a possibility that needs to be taken into account.
I don't have the smarts to sim a season, so I use the following approach.
Let's say there is a 50 percent chance a player will get 630 PA and clock 41 homers. Now let's say this player is coming off an injury and may start out slow, so there is a 25 percent chance he hits only 34 homers in 630 PA. There's also a 25 percent chance he's not ready for Opening Day and struggles, so he collects only 450 PA with 27 HR.
Homers:
.5 x 41 + .25 x 34 + .25 x 27 = 36
PA
.5 x 630 + .25 x 630 + .25 x 450 = 585
If you haven't figured it out by now, this isn't an arbitrary example, it's Ohtani. My original projection was the best-case scenario; I didn't properly account for a slow start and missing playing time.
Here are some other players I changed, along with the rationale.
Players I Improved
| WAS | IS | |
|---|---|---|
| Bryce Harper | 27 | 16 |
Harper was the reverse of Ohtani in that I shorted him some playing time. He's a tough guy to peg since he hasn't played a full season since 2019, though he only missed two games in the truncated 2020 campaign. However, much of the time Harper missed in 2022 was due to a fluky hit by pitch, and he missed the beginning of last season rehabbing from Tommy John surgery. Once he returned May 2, Harper missed just six games, including the last two of the regular season to give him a rest before the playoffs.
My initial projection pegged Harper for 140 games. The update added seven games, which still may not be enough.
| WAS | IS | |
|---|---|---|
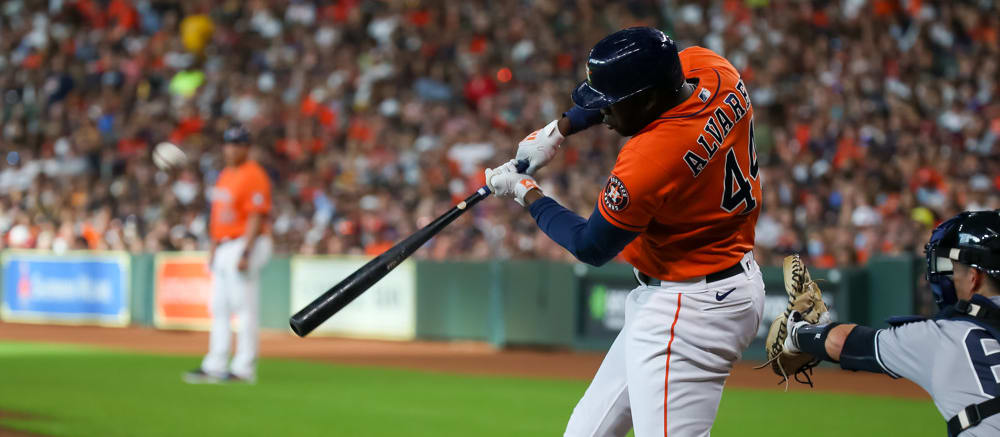
| Yordan Alvarez | 36 | 24 |
Ditto for Alvarez, I was too conservative on playing time. Admitting this twice after explaining why playing time estimates should be kept in check feels borderline disingenuous, but not drafting Alvarez until the third round is just wrong, especially since he has outfield eligibility.
Alvarez lands as the No. 6 overall hitter in my version of the Steamer 600 where everyone is assigned equal plate appearances. Even without steals, he's one of the best fantasy producers in the game. In 2022, he endured a couple of mysterious hand issues, then last season he missed a tad over six weeks with a sore right oblique.
The most games Alvarez has played is the 144 posted in 2021. The following season he appeared in 135 contests, then 114 last year. My initial projection called for 123. Given, it's more than last season, but it felt light. On the other hand, splitting the difference between 2021 and 2022 seems aggressive, since Alvarez is a big guy and susceptible to pulls and strains.
I settled on 130 games, which is coincidentally just one fewer than his average of the past three seasons. This passes the sniff test since Alvarez is now ranked just below Corey Seager and Vladimir Guerrero on my list, which is in lockstep with how I would draft. It keeps me low man on Alvarez, but there is too much injury risk for me to draft him in the first round, which is where my colleagues have him residing.
| WAS | IS | |
|---|---|---|
| CJ Abrams | 78 | 58 |
This is another example of a playing time adjustment, but for a different reason. Last season, Abrams batted eighth or ninth 65 times, mostly in the first half. He batted leadoff 71 times, mostly in the second half.
In the spirit of having projections be a reflection of plausible outcomes, I accounted for Abrams slumping, and being dropped in the order for some of the season. In retrospect, I decided I'd given him too many lower in the order plate appearances, and increased the projection from 627 PA to 658 PA. For point of reference, a full season hitting first for the Nationals renders around 738 PA, compared to 619 in the eight-hole.
| WAS | IS | |
|---|---|---|
| Chas McCormick | 222 | 113 |
Chalk up another change to playing time. For a few seasons, the Astros seemed hesitant to commit to McCormick as a regular. Be it Jose Siri, Pedro Leon or Jake Meyers, there was always someone else in the mix. My original set kept this line of thinking and assigned McCormick only 465 PA, which is eight more than he garnered last season, a career high.
After looking at the Astros overall playing time grid, and trying to foretell their offseason moves, I decided this was the season McCormick played a lot more. Even so, I increased him to a still conservative 530 PA, figuring he'll continue to hit lower in a stacked lineup and still miss some playing time. However, with a new manager, Michael Brantley out of the picture and a likely desire to slot Alvarez at designated hitter, there's playing time upside, and if my colleagues ranks are a good reflection of the market, McCormick will be populating a majority of my rosters. I have a feeling he's going to be a favorite for me on the Underdog Best Ball format.
| WAS | IS | |
|---|---|---|
| Spencer Torkelson | 231 | 142 |
The change is best illustrated by a series of slash lines:
| BA | OBP | SLG | |
|---|---|---|---|
| 2022 | 0.203 | 0.285 | 0.319 |
| 2023 | 0.233 | 0.313 | 0.446 |
| 2023 pre ASB | 0.228 | 0.309 | 0.402 |
| 2023 post ASB | 0.238 | 0.318 | 0.498 |
| 2024 initial | 0.228 | 0.315 | 0.414 |
| 2024 current | 0.241 | 0.315 | 0.450 |
The initial projection was completely formulaic, dismissing the possibility Torkelson figured something out, and was a different player over the second half. Normally, I don't put a ton of credence into first and second half splits, but that's more for an established player. Torkelson turned 24 years old last August, so he merits some benefit of the doubt.
The current projection mimics Torkelson's second-half batting average, with some accounting for a .253 expected batting average last season. Torkelson also undershot his expected .487 slugging, so the current .450 may in fact be low, but it certainly better than the laughable .414 driving the initial ranking.
As opposed to McCormick, where I am the high man, even after the adjustment, I remain the low man on Torkelson. I'm good with that. His second half was encouraging, and likely signals improvement, but paying for the full extent is too rich for me.
Players I Dropped
| WAS | IS | |
|---|---|---|
| Christian Encarnacion-Strand | 42 | 128 |
The change was related to the extent I overrode the MLE translations. Encarnacion-Strand essentially broke the system. The unadjusted MLE projection was far too optimistic. It didn't help that he posted a solid .805 OPS after he was called up.
| BA | OBP | SLG | |
|---|---|---|---|
| 2023 | 0.270 | 0.328 | 0.477 |
| unadjusted 2024 | 0.276 | 0.349 | 0.525 |
| initial 2024 | 0.260 | 0.344 | 0.522 |
| current 2024 | 0.251 | 0.323 | 0.487 |
Softening the MLE (unadjusted) projection is all subjective, but where I originally landed feels too optimistic. I mean, who knows, but is that really a weighted average of all plausible outcomes?
To be honest, the current projection feels too rosy with respect to power and may require further refinement. Or maybe not. This is a guy with an uppercut swing, resulting in a plethora of fly balls with an above average exit velocity... in the Great American Ballpark. That's, um... encouraging.
What about strikeouts? This sort of profile is often accompanied by a rate north of 30 percent. Encarnacion-Strand fanned at a 28.6 percent clip with the Reds last season which is high, but not egregious. His minor league track record portends something in the low twenties. You know what? I'm sticking with the current expectation.
| WAS | IS | |
|---|---|---|
| Ezequiel Tovar | 56 | 179 |
This is another MLE conundrum. Translations are sketchy enough, and they're limited to action in Double- and Triple-A. In 2022, Tovar gathered only 295 plate appearances with Double-A Hartford and just 23 with Triple-A Alburquerque. Those translations are then embellished by Coors Field. Sure, Coors Field will help a hitter, but everyone is affected differently. A player with major league experience with the Rockies will have that influence reflected in his stats, but Tovar played just one season in the Show, so his park effect influence hasn't been established.
| HR | R | RBI | SB | BA | OBP | SLG | |
|---|---|---|---|---|---|---|---|
| 2023 | 15 | 79 | 73 | 11 | 0.253 | 0.286 | 0.408 |
| Initial | 18 | 75 | 73 | 20 | 0.272 | 0.314 | 0.449 |
| Current | 17 | 71 | 70 | 10 | 0.257 | 0.298 | 0.429 |
Again, this is a subjective call, but I was unhappy how much of the projection was driven by Tovar's 2022 minor league numbers, which were then boosted by altitude. Not to mention, the majority of the stolen base component was stealing 17 in 20 chances in 295 Double-A PA. With the league pilfering at an 80 percent clip, Tovar was at 69 percent.
My confidence level for this projection is low. On the other hand, it appears I am still ahead of the market. Maybe the optimal approach is targeting Tovar as a middle infielder in mixed leagues, with the intent on using him for home games. I don't have to draft him commensurate with my projection; there is some wiggle room relative to the market.
| WAS | IS | |
|---|---|---|
| Cody Bellinger | 66 | 110 |
Bellinger is still a work in progress since where he signs will influence his numbers. The reason for the drop was a closer look at his underlying metrics. He clubbed 26 homers, three more than expected according to Statcast. He recorded 153 hits, a whopping 20 more than expected. Expected stats aren't the be-all, end-all, but they're a part of the equation.
Metrics like average exit velocity and hard-hit rate are indirectly part of the Statcast expected stats determination, so care must be taken not to penalize twice in analysis, but a 22nd percentile average exit velocity and 10th percentile hard-hit rate are too low to ignore. My standard process averages expected and actual, but with Bellinger I shifted the lever more to expected. The result was a lower ranking.