This article is part of our The Stats Room series.
Football is a tough sport with most players only lasting in the league a short time. In this brutal game, how long can players last before they begin to fall apart? Is the decline slow and steady or an immediate drop? Let's examine how football players' production changes as they age.
Teams have taken player decline into account for years, lowering the value placed on drafting running backs, especially. With the grind of years of defenses hitting them, running backs come to the league possibly broken already. Then as they break down, they are quickly replaced with a younger, faster, cheaper model.
Wide receivers, on the other hand, come into the league with a large learning curve. The quarterback and receiver must get on the same page for timing routes for those perfect passes. This learning takes time. Additionally, wide receivers don't take the constant pounding running backs endure with every gang tackle.
To find how these players age, I will use a process of determining aging curves that I used with baseball players called the delta method (detailed link).
The aging curve was created by the delta method by chances using their harmonic means. With this method, there's a small survivor bias summarized by Mitchel Lichtman at the Hardball Times:
… survivor bias, an inherent defect in the delta method, which is that the pool of players who see the light of day at the end of a season (and live to play another day
Football is a tough sport with most players only lasting in the league a short time. In this brutal game, how long can players last before they begin to fall apart? Is the decline slow and steady or an immediate drop? Let's examine how football players' production changes as they age.
Teams have taken player decline into account for years, lowering the value placed on drafting running backs, especially. With the grind of years of defenses hitting them, running backs come to the league possibly broken already. Then as they break down, they are quickly replaced with a younger, faster, cheaper model.
Wide receivers, on the other hand, come into the league with a large learning curve. The quarterback and receiver must get on the same page for timing routes for those perfect passes. This learning takes time. Additionally, wide receivers don't take the constant pounding running backs endure with every gang tackle.
To find how these players age, I will use a process of determining aging curves that I used with baseball players called the delta method (detailed link).
The aging curve was created by the delta method by chances using their harmonic means. With this method, there's a small survivor bias summarized by Mitchel Lichtman at the Hardball Times:
… survivor bias, an inherent defect in the delta method, which is that the pool of players who see the light of day at the end of a season (and live to play another day the following year) tend to have gotten lucky in Year 1 and will see a "false" drop in Year 2 even if their true talent were to remain the same. This survivor bias will tend to push down the overall peak age and magnify the decrease in performance (or mitigate the increase) at all age intervals.
Basically, the decline seen by players may not be as steep as in real life. Simply, the process equalizes the numbers of units (e.g. yards, catches, fumbles) chances (receptions, targets, carries) and then finds out how this rate changes for players as they age.
To start examining aging curves, we need to get a basic idea of how any athlete ages, especially those who rely on speed. Here is a graph of the sprinter aging curve:
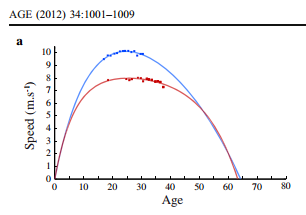
A person's peak sprinting speed is likely to be about age 24 to 25, and people aren't trying to tackle these sprinters. While the following curves show heavy declines, players enter the league almost at their peak performance level if they were normal athletes.
Finally, I would have loved to do some red-zone and goal-line aging rates, but my current dataset is not set up to with those statistics. Sorry. I am looking at a way to calculate them for a future article.
Running backs
Running backs seem to rarely have a lock as a team's featured back and if they do, they quickly lose the job. The reason for the high turnover is the steep decline as they age. The most basic aging graphs, yards per carry, to show this decline.
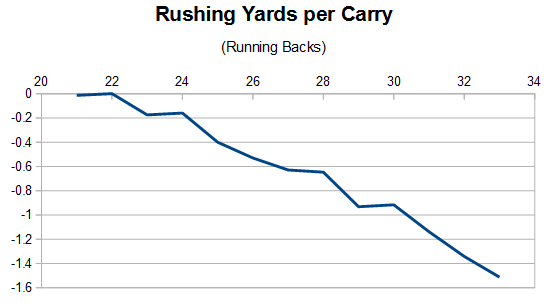
The drop is a decent decline with the average decline an eighth of a yard per carry. The amount of decline equates to a running back losing one yard per carry between age 22 and 30. This one-yard drop is the main reason running backs aren't normally in the league after turning 30.
Even though there is a steady drop, for the first few seasons the drop is not as steep. This trend can be seen in future graphs and adds up to a decent improvement.
Another graph that mimics the previous graph is touchdowns per carry.
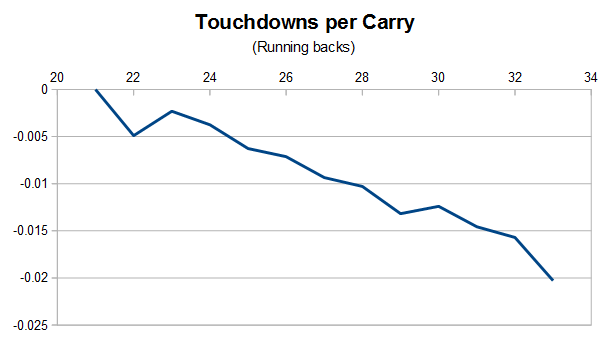
A pretty similar correlation of yards ran and touchdowns scored (e.g. rocket science).
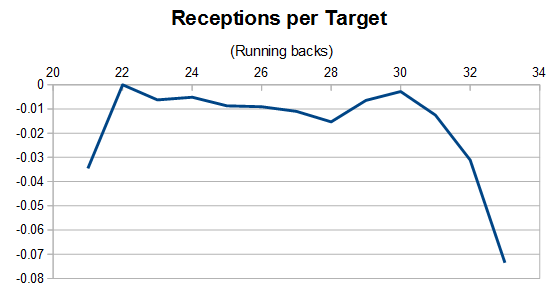
Running backs have been known to enter the league with stone hands and then develop some skills in the NFL. The next two graphs show how their average yards per catch and receptions per target peak.
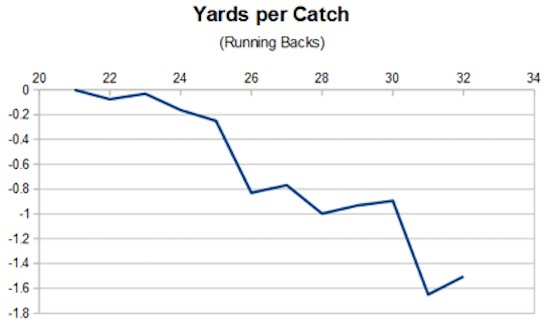
The decline in yards per catch matches with the rushing yard decline graph. No signs exist for these guys speeding up.
Even though the back is physically declining, he is able to make some adjustments early in his career by catching a few more balls throw his way.
Besides the back's production, how well do they hold onto the football? Here is their fumble rate per touch attempt ages.
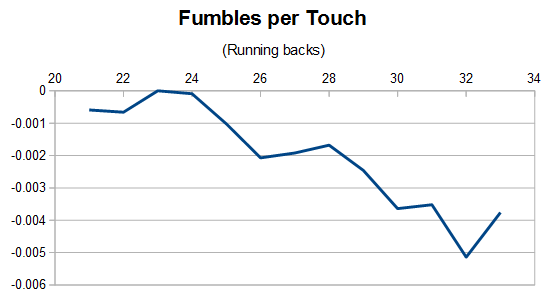
Well, this graph is still in the downward direction, but this time the news is positive. As running backs age, they become less and less likely to fumble.
Finally, here is the fantasy points (standard) aging curve for running backs per touch. I bet you can't guess the trend.
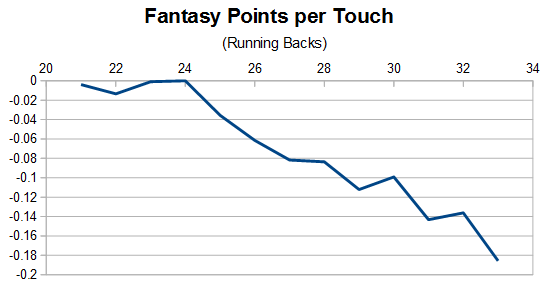
No surprise, another downward trend. But the drop doesn't start until the back turns 25. A small improvement in fumble rate and a slower decline in the first few seasons can give an owner some hope.
Consider these first few seasons to be an overall peak, with the decline next.
The average decline from age 24 to 31 is 0.0205 points per touch. Now, this may not seem like a lot, but it works out to about five points per season for a 250-touch back.
The results are a little depressing, but most people have expected this trend for years. At least now we know for certain and can adjust our fantasy strategies accordingly.
Now onto the wide receivers.
Wide Receiver Aging
Let's start with two graphs thaty give the general shape of how a receiver ages -- completion percentage and yards per catch.
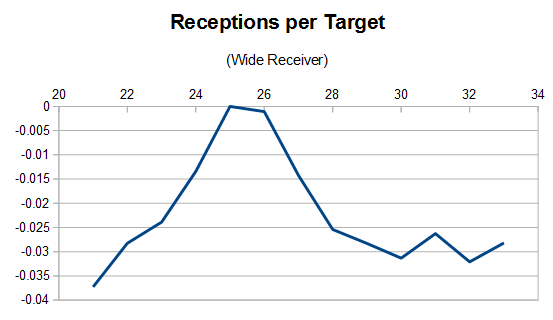
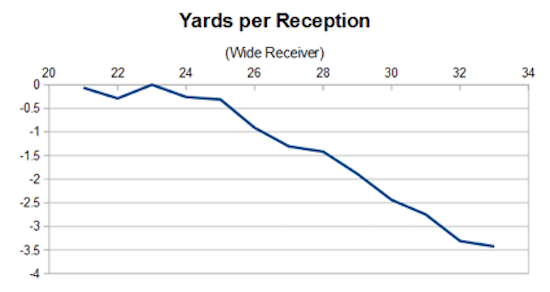
Hurray, our first real curve up and curve down appears with the receptions per target graph. Additionally, yards per reception doesn't exactly fall off like it did for running backs. It stays steady until age 25 and then begins its decline, more like the sprinter aging curve.
Now it's time to morph both graphs into a single graph, yards per target.
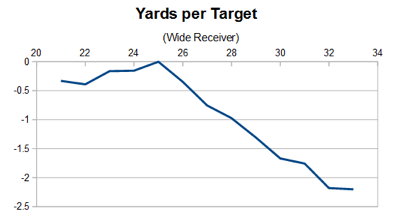
The graph results show a slow improvement until the age-25 season and then all the gains from the previous three season are lost in one year. Some 26-year-old receivers who might see a decline are Travis Benjamin, Kamar Aiken, T.Y. Hilton and Julio Jones.
Again, no red-zone touchdown data was available, but here is the wide receivers touchdowns per target aging curve.
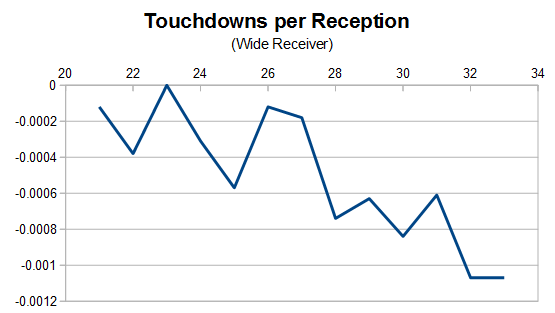
That is one ugly graph. A downward trend exists, but a receiver's age-21 and age-27 value are almost identical. It will be interesting to see how this chart combines with the yardage and touchdown charts for a final fantasy points curve.
One more for reference, fumbles per reception.
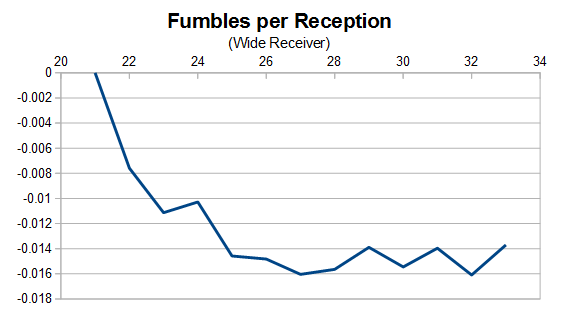
Like running backs, receivers find a way to keep ahold of the ball better and better as they age.
Now, one final graph that puts all the above information together, fantasy points (standard) per target.
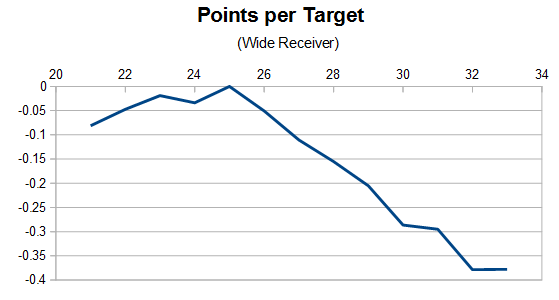
The curve works out to an age-25 peak and steady decline the next year. There really isn't a multi-year peak, just an up and down.
In the upward trend phase, the average improvement over these years is .0203 points per target or 2.5 fantasy point per 125 targets. On the decline phase, the rate is obviously steeper at -0.0541 point per target or 6.8 points per target.
Summing it up
Thanks to the few readers who made it to the end. I know the previous data was pretty dry, but it is the base work for future aging analysis. With the base curves, we can compare how running backs age who took a beating in top conferences like the SEC. Is there a difference in aging for tall or short receivers? How do running backs age after a 300-plus season? With the baselines, the comps can now begin.
That is it for today. This topic is a little dense and I understand if you have any questions on them, so feel free to ask away.