


A special bonus edition of Odds and Ends with 31 stats from 31 teams … for free!
Happy Holidays!
 Anaheim Ducks: -30
That's the Ducks' net penalties differential (penalties drawn minus penalties taken), which is the lowest mark in the league. At this rate, they would finish the season with -66, tying themselves (yup, themselves) for the lowest mark this decade. The Ducks finished with the lowest net penalties differential last season (-60) and the season before (-66).
 Arizona Coyotes: 60.38
That's the CF% when Taylor Hall and Phil Kessel are on the ice 5-on-5 through 24:49 TOI, according to Natural Stat Trick, generating 32 chances and giving up 21. That's an elite percentage; from 2010-2013, the Sedins at their peak registered a 59.38 CF%.
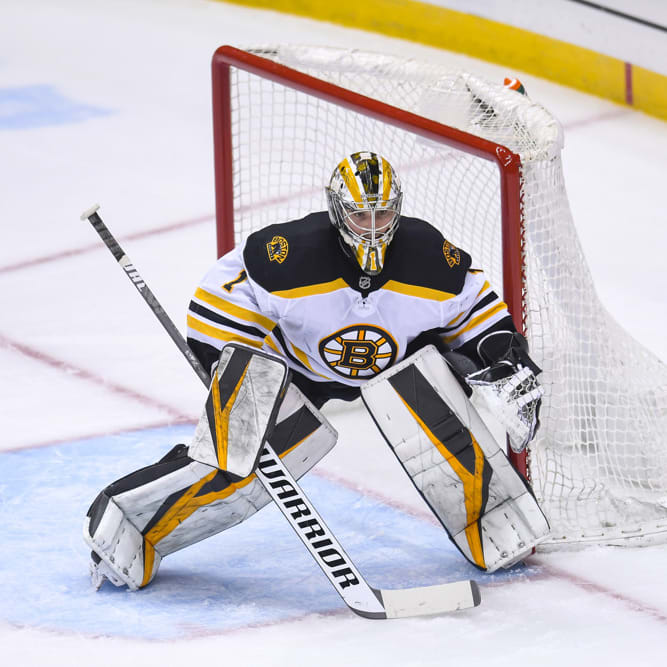
 Boston Bruins: 3.64
That's Brad Marchand's P/60 (min. 20 GP), which is the highest in the league, just ahead of Evgeni Malkin and Nathan MacKinnon. We begrudgingly admit that the biggest rat in Boston since The Departed is an elite scorer, and since the 2017-18 season ranks third at 2.91 P/60 behind Connor McDavid (2.98) and ahead of Auston Matthews (2.78).
 Buffalo Sabres: 0.5
That's the difference in P/GP between Jack Eichel and Victor Olofsson, their second top scorer. It is the biggest gulf between teammates among the top five scorers, a testament to how good Eichel has been and how mediocre the rest of his team is. Could you imagine if Olofsson hadn't come overseas this season?
 Calgary Flames: 1
That's how many points Mark Jankowski has scored, the lowest total among forwards with at least 30 games played and one of three forwards (Joe Thornton, Frans Nielsen) without a single goal. At this rate Jankowski will finish the season with just two points, which would be the lowest total (min. 60 GP) since 2011-2012 when Brad Staubitz finished with one goal in 62 games.
 Carolina Hurricanes: 59.4
That's the average SAT% between the three-headed monster of Teuvo Teravainen, Andrei Svechnikov and Sebastian Aho this season, who rank first, third and sixth in the league, respectively. That's the highest average rating by a trio of teammates since 2016-17 when the Bruins had Bergeron, Marchand and Colin Miller finished with 60.6 SAT%. When talking about great young cores and dominant lines, we keep forgetting about the jerks.
 Chicago Blackhawks: 8.56
That's how many high-danger shots Corey Crawford faces per game on average, according to Natural Stat Trick. It is, by far, the highest rate in the league, yet he ranks fifth in HD Sv%. The Blackhawks hang their goalie out to dry more than any other team, and Crawford and Lehner's combined .925 Sv% at even strength is indicative of how good they've been despite a leaky defense this season.
 Colorado Avalanche: 72
That's how many points Cale Makar's on track to score if he doesn't miss any more time this season. His 0.97 P/GP average is the highest average for a rookie defenseman since Larry Murphy's 0.95 in the 1980-81 season, and it'll also be the first time a rookie defenseman scored more than 60 points since Nicklas Lidstrom did it in the 1991-92 season — truly historic.
 Columbus Blue Jackets: 5%
That's the difference in shot rates at 5-on-5 from this season to last season, according to HockeyViz. The BJ's generated three percent more shots than the league average last season, but this season that has generated two percent fewer shots. Their 7.9 S% also ranks 28th in the league after finishing 10th with 9.9 S% last season. Losing Artemi Panarin and Matt Duchene hurt, but so has some really poor puck luck.
 Dallas Stars: 0.46
That's Jamie Benn's P/GP average this season, the second straight season he's seen such a huge drop. It ranks 162nd out of 288 players (min. 30 GP), and he likely will be the first Art Ross winner to not make the Hall of Fame. He's still a top-5 left winger this decade, but he's clearly on the downside of his career.
 Detroit Red Wings: -144
That's the goal differential the Red Wings will finish the season with at their current rate, by far the lowest this decade. The 2016-17 Avalanche, who hold the record for the lowest point total in an 82-game season this decade with 48 points, finished that season with a goal differential of -111.
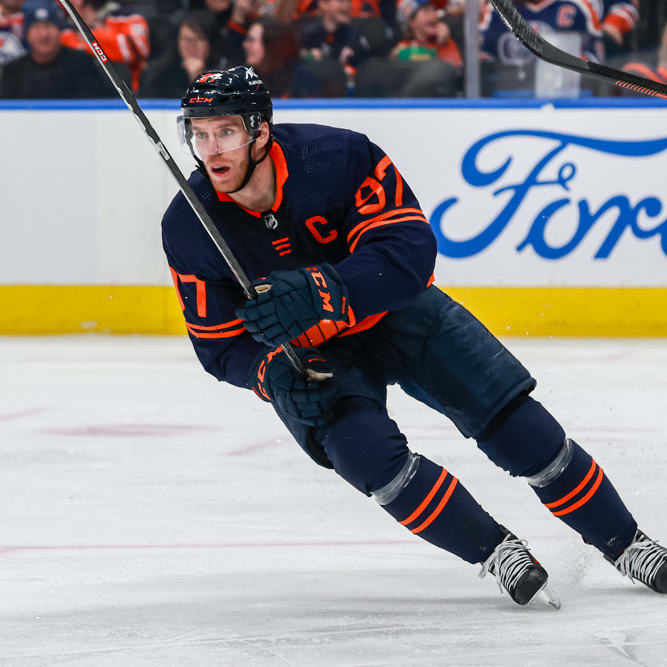
 Edmonton Oilers: -16
That's Leon Draisaitl's plus-minus this month, by far the lowest mark in the league. Remember when we were talking about how Draisaitl might be a franchise player on his own? Hogwash. His even-strength play has been atrocious, and nine of his 12 points this month have come on the power play.
 Florida Panthers: 832
That's Keith Yandle's iron man streak of games played, the longest streak among active players and fourth longest all time. Fun fact: Yandle can end the decade with 870 games played since the 2009-10 season, two more than is normally possible (82 games for 10 seasons, plus 48-game shortened season) because he managed to play 84 in the 2014-15 season.
 Los Angeles Kings: $620,669.11
That's the estimated cost per point scored for Ilya Kovalchuk this season based on a signing bonus of $5.3 million and $700,000 salary, according to CapFriendly, committing the biggest robbery in the history of L.A. since Heat.
 Minnesota Wild: .646
That's the Wild's point percentage since Nov. 1, which is eighth highest in the league, after finishing October in 30th place. The turnaround is astounding, and once again a Bruce Boudreau-coached team is finding its way into the playoffs. The biggest reason? Offense. Minnesota's 3.50 GF/GP is second-highest since Nov. 1 after averaging 2.31 GF/GP in October.
 Montreal Canadiens: 45
That's how many more points Max Domi has scored than Alex Galchenyuk after the two were swapped for each other, though Domi has played 19 more games. Say what you want about Marc Bergevin, but he's made some trades that have looked very good in retrospect, including this one and the P.K. Subban-Shea Weber swap.
 Nashville Predators: 0
That's how many times the Predators have had a player finish with more than 70 points this decade, the only team to have this unenviable title. Ryan Johansen and Filip Forsberg came closest with 64 points, and it's further proof that despite being a very good offensive team for most of the decade, it was done largely by committee.
 New Jersey Devils: 0
That's how many players who have a positive SAT%, meaning that no matter who the Devils put out on the ice, they're getting out-chanced every single shift. Even the Red Wings have five players who are in positive territory, and this just means further hell for MacKenzie Blackwood or whoever is in net for the Devils. The only other team to not have a player with over 50 SAT%? The rival Rangers.
 New York Islanders: 28.2
That's how many shots the Islanders are averaging per game, the lowest in the league, yet they're still second in the tough Metro Division. If there's a team that confounds the analytics community, it's the Isles, who are average or below average in just about every metric, yet continue to play well and get really good goaltending from their tandem.
 New York Rangers: 1,363
That's the number of shot attempts the Rangers have this season at 5-on-5, which is the fewest in the league. It explains why their possession numbers are so awful, and also how their 17-14-4 record is so surprising. Their SAT differential pro rates to -829 for the season, which would be the seventh-worst differential in the league and the worst in franchise history since the NHL started keeping track in 2009-10.
 Ottawa Senators: 0
That's how many power-play goals Sens defensemen have scored this season, the only team yet to score one. Three other teams (Boston, Toronto, Vegas) have one goal, but only the Sens have this dubious honor. Thomas Chabot has generated 120 individual shot attempts on the power-play since last season, but he has only one power-play goal to show for it. Maxime Lajoie led the team with four last season.
 Philadelphia Flyers: 0.625
That's their point percentage this season, just slight above Alain Vigneault's average of 0.585 in his first season with a new team. At every single stop — Montreal, Vancouver, Broadway — Vigneault's teams have always made the playoffs in his debut season. Only two other coaches share this distinction: Joel Quenneville and Dave Tippett.
 Pittsburgh Penguins: 10.67
That's how many points the Penguins have lost due to injuries as of Dec. 19, according to Man Games Lost. That's, of course, because Sidney Crosby, Nick Bjugstad, Brian Dumoulin and Patric Hornqvist were hurt for extended periods, and if those points are added back, the Pens would've had 54 points as of Dec. 19, putting them first in the league. Mike Sullivan isn't getting enough credit this season.
 San Jose Sharks: -23.58
That's how many goals Martin Jones has saved compared to the league average, according to Natural Stat Trick, which is the lowest in the league. That means, had Jones even posted a league-average save percentage, he would've allowed 23 fewer goals, which would've pushed the Sharks' GA total down to 101, which would rank 12th fewest in the league as opposed to 30th.
 St. Louis Blues: .870
That's the Blues' save percentage in high-danger chances, the best in the league. Even though they're 23rd in shots/GP with a negative shot differential, they remain tops in the Central Division. Jake Allen has been a surprisingly good contributor in that regard with a .895 HD Sv% (min. 10 GP), which is best in the league.
 Tampa Bay Lightning: .480
That's Andrei Vasilevskiy's quality starts percentage, which is 35th in the league (min. 10 GP) and on par with Jonathan Quick, according to hockey reference. That's a huge dip from last season's .642, which ranked fifth. Tampa Bay is coming on strong after a slow start, but if there's anything holding it back from becoming elite again, look no further than their unreliable goaltending.
 Toronto Maple Leafs: 0
That's how many games the Leafs have won when trailing after two periods, just one of four teams yet to mount a third-period comeback this season. They were similarly ineffective in comeback wins last season, with just three comeback wins in 31 opportunities. What's slightly concerning is that they are blowing leads far more often this season; they have a .727 Win% (17th) when leading after one period and .824 Win% (18th) when leading after two, compared to .828 (7th) and .973 (1st) last season, respectively.
 Vancouver Canucks: 17
That's Elias Pettersson's individual net penalties differential, which is the best in the league, and four more than four others tied for second place. That's a plus-37 differential over the course of the season, which would be the third highest this decade. If you're wondering why the Canucks have a league-high 140 power-play opportunities, look no further than Pettersson.
 Vegas Golden Knights: 1.05
That's Reilly Smith's G/60 rate at 5-on-5, the lowest among all 31 team leaders (min. 30 GP). The Vegas roster doesn't have a high-end scorer, but what it lacks in quality it makes up for in quantity. The Knights are 18th in GF/PG but they've never finished a season with fewer than five 20-goal scorers.
 Washington Capitals: 213
That's the number of goals Alex Ovechkin needs to tie Wayne Gretzky for the all-time record. At Ovechkin's average pace of 49 goals per season, he needs to play five more seasons before he can catch Gretzky, at which point he'll be 39 years old. Doable? Yes. Difficult? Very.
 Winnipeg Jets: 15.34
That's Connor Hellebuyck's league-leading GSAA this season, according to Natural Stat Trick. There's zero question he's been their MVP this season, and after a summer in which only two of their six regular defensemen returned, he has singlehandedly propelled the Jets to playoff contention.